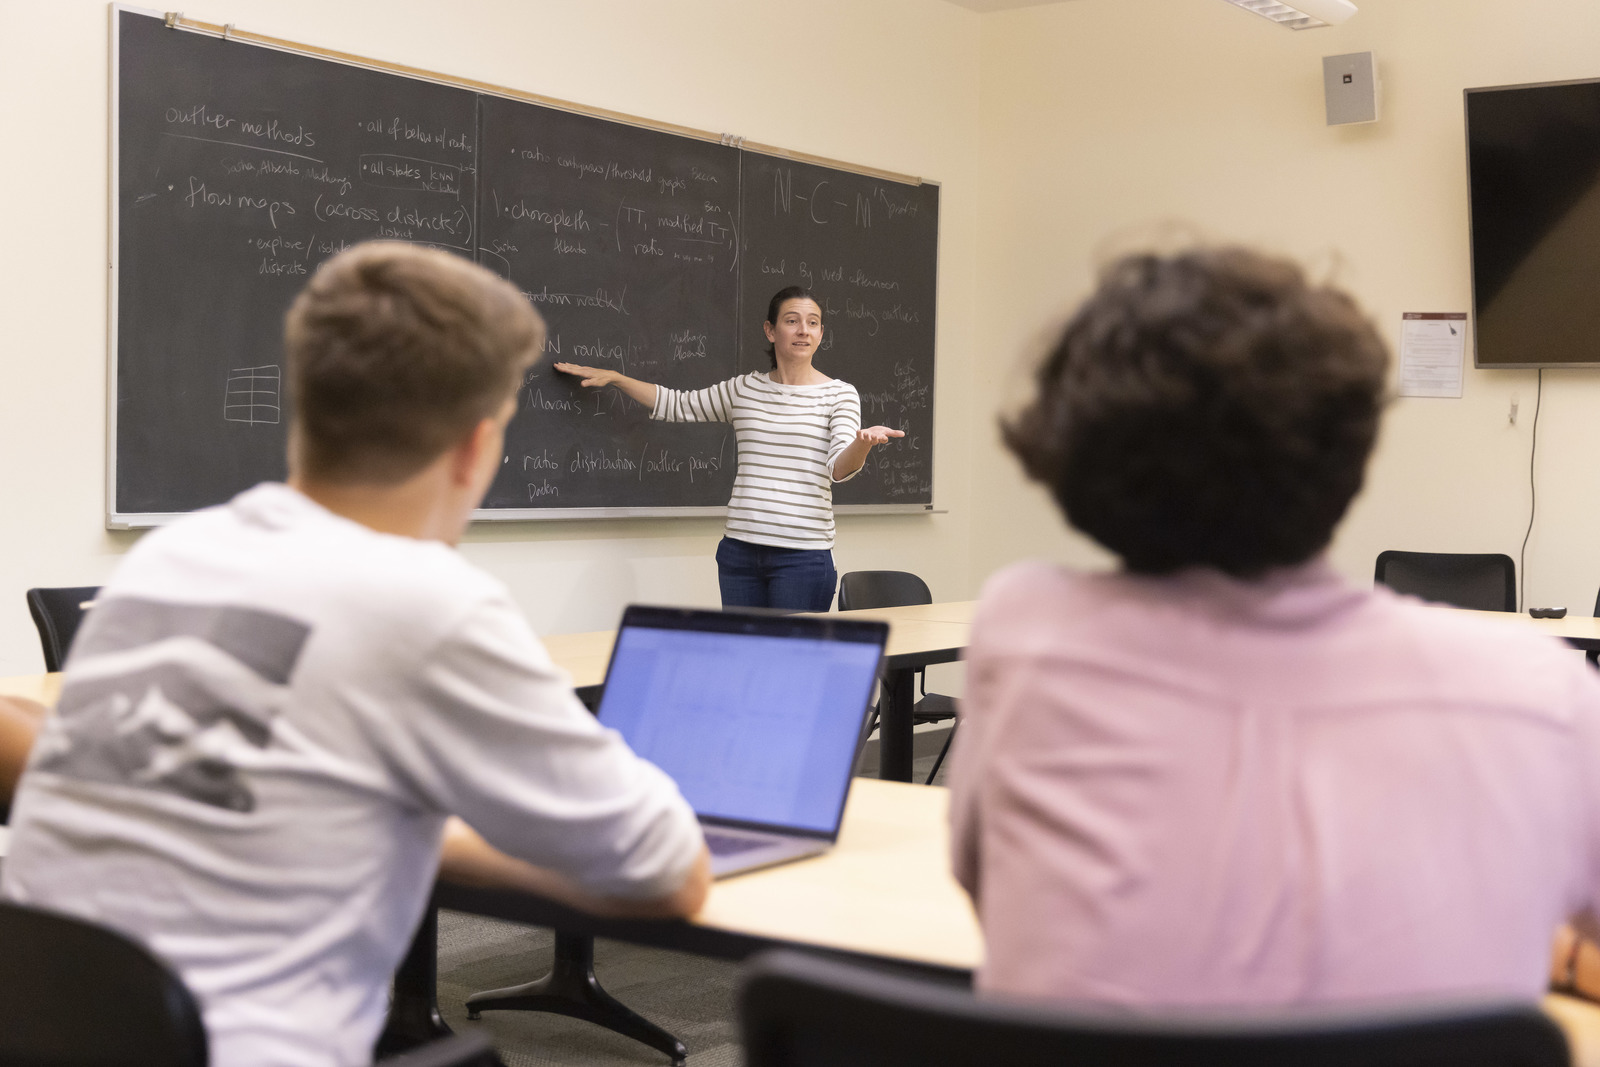
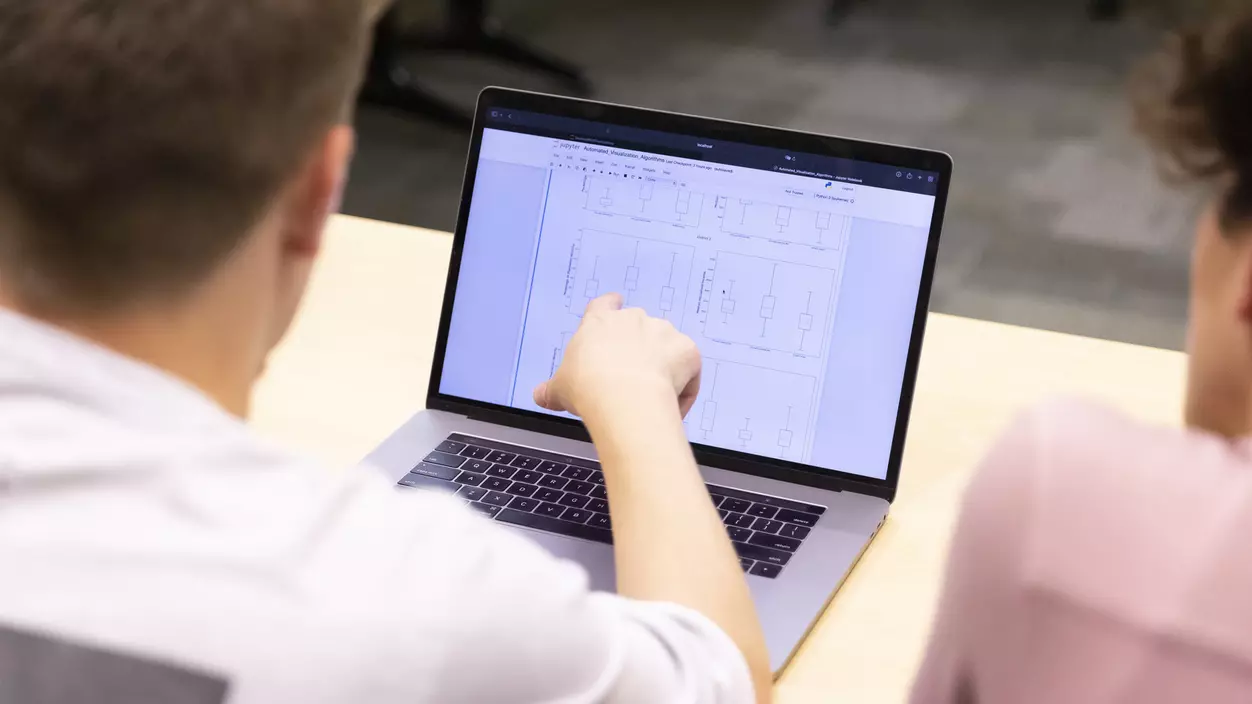
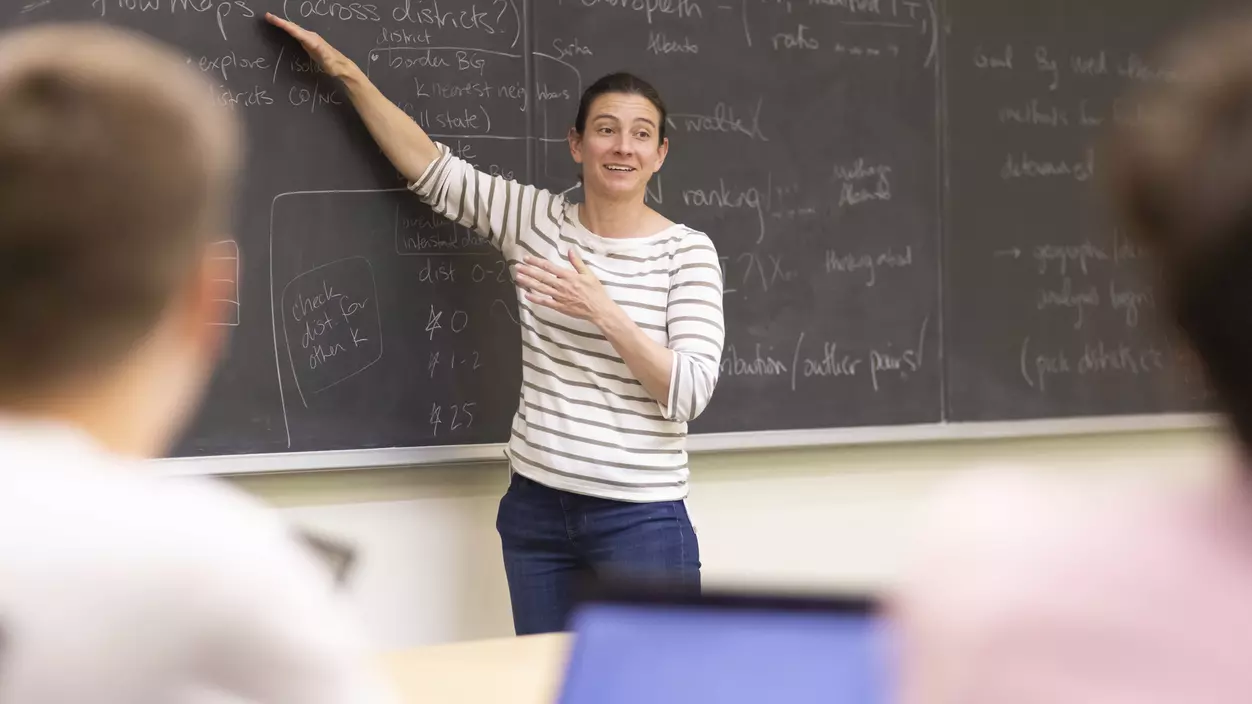
Students use math, geography, and other disciplines to examine the way electoral maps are drawn.
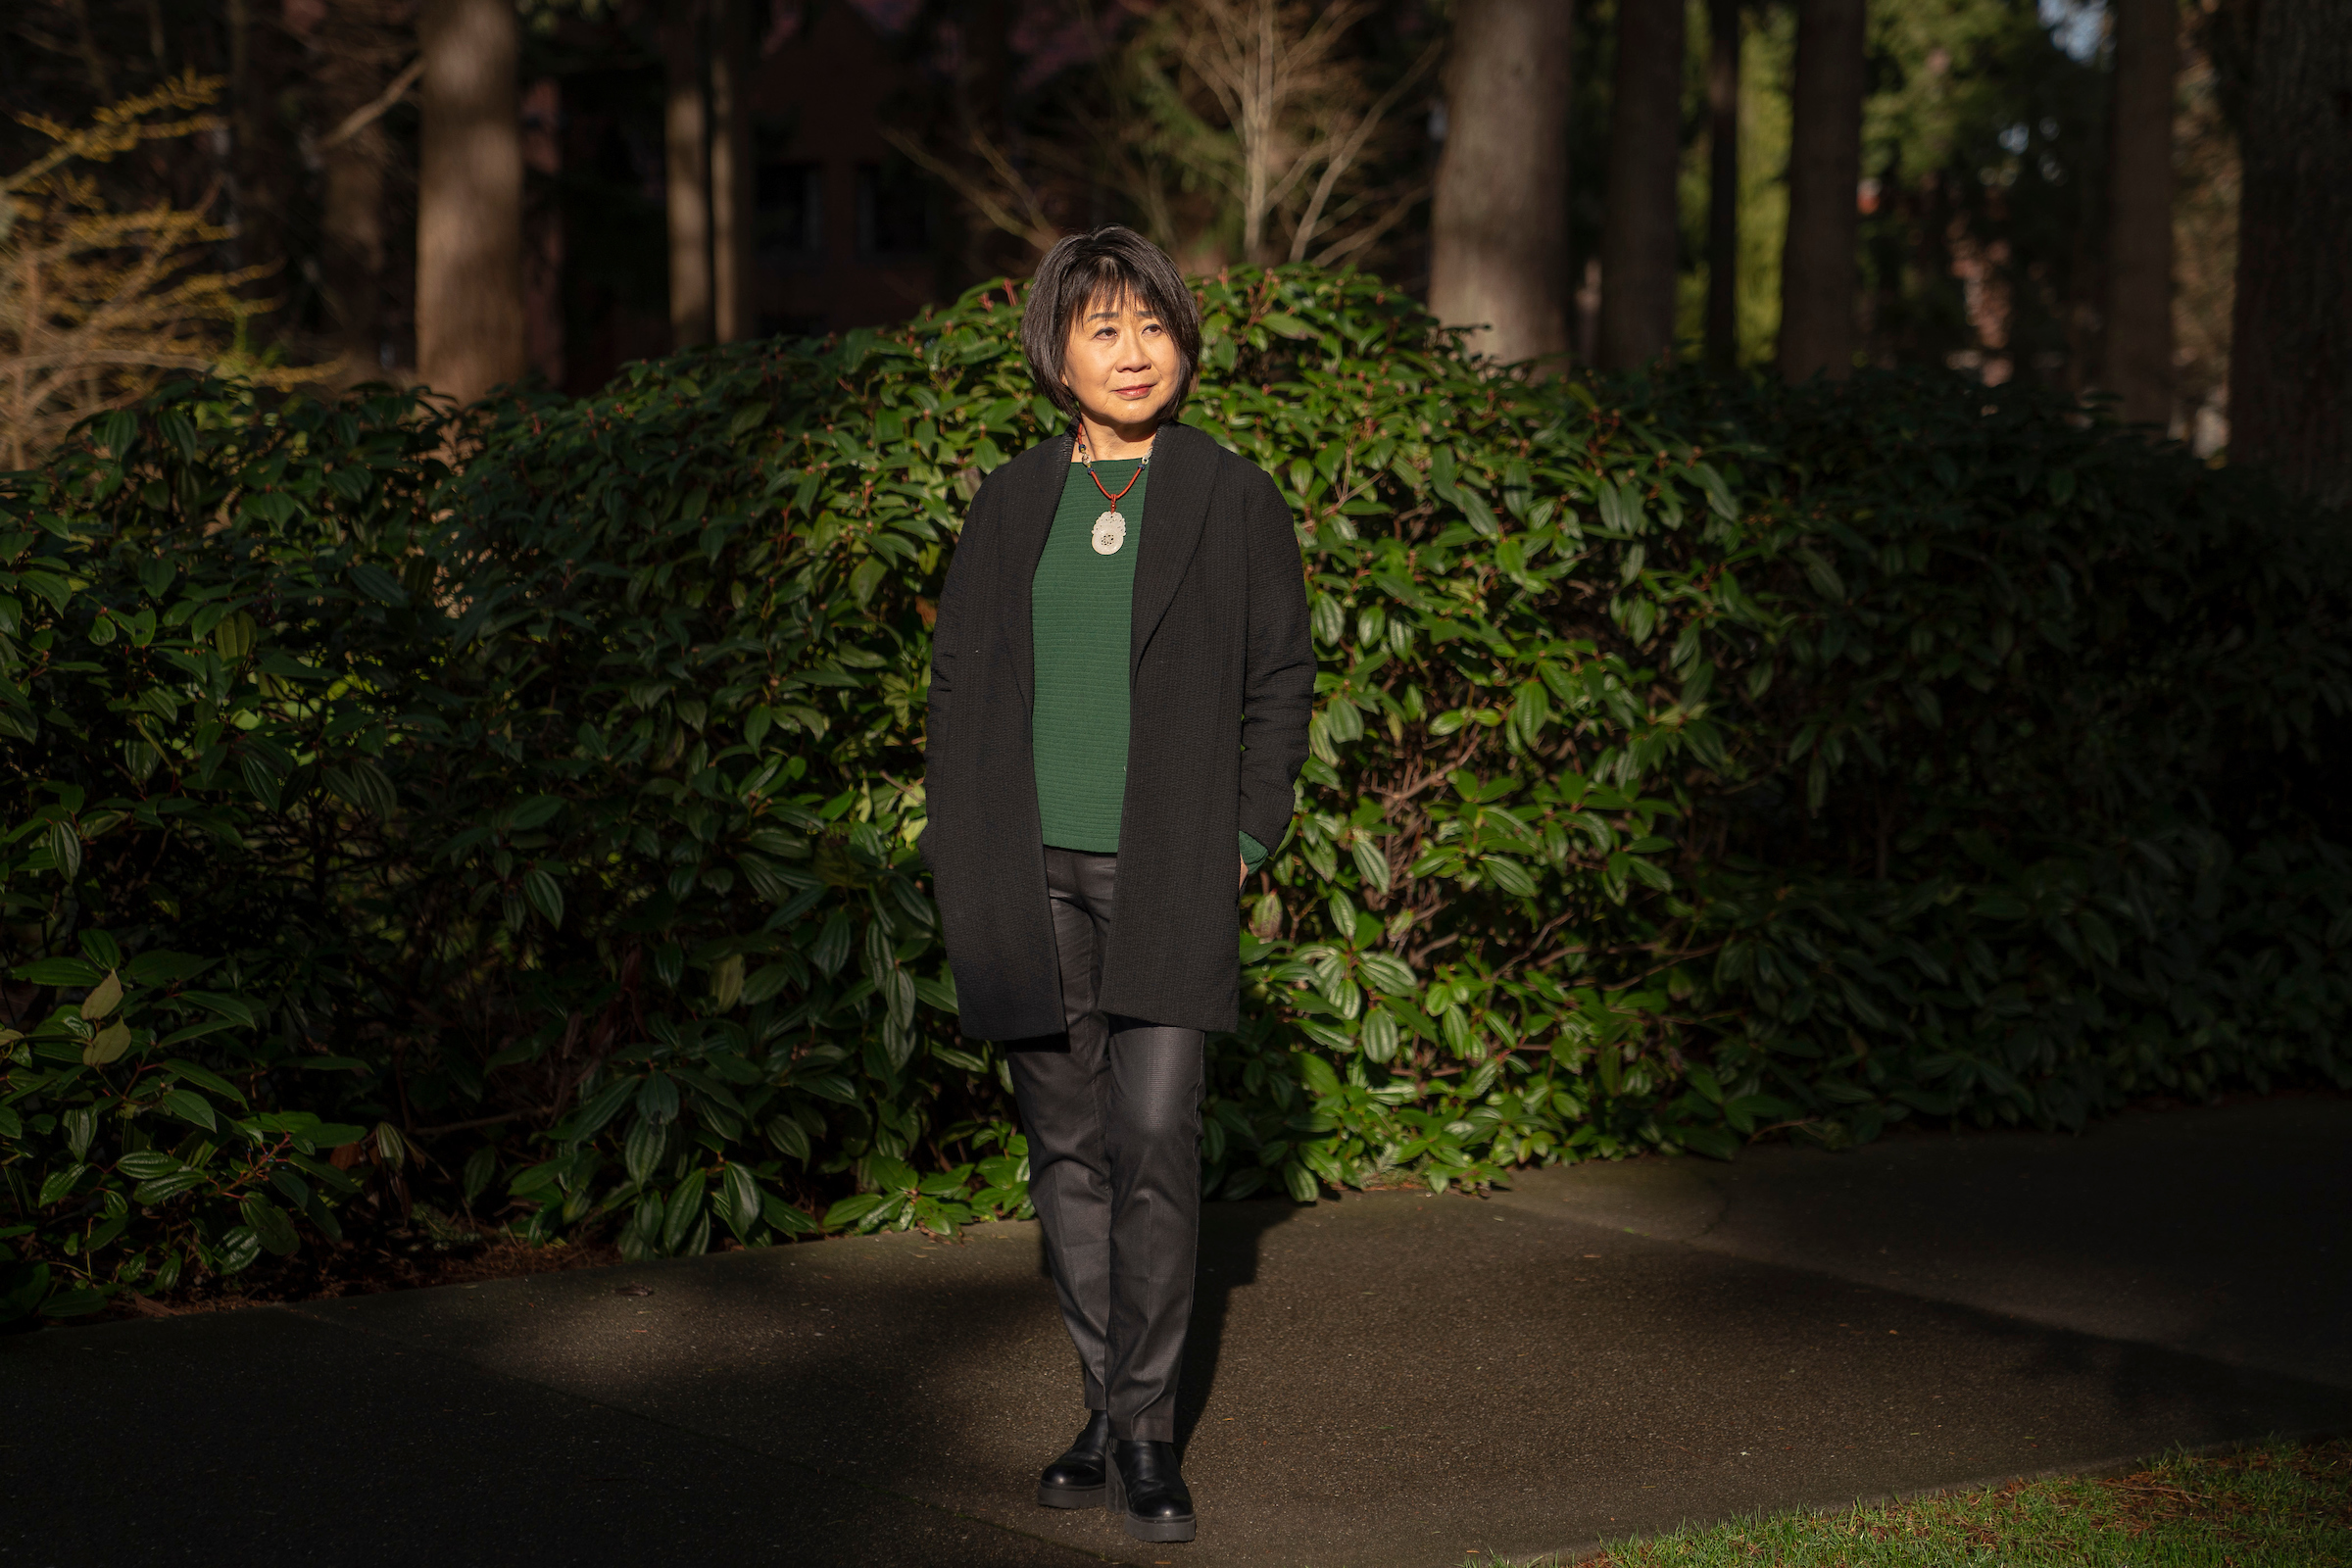
In 2019, as the federal government began preparations for the 2020 U.S. Census, Associate Professor of Mathematics and Computer Science Courtney Thatcher was doing a lot of thinking about the problem of redistricting.
Every 10 years, the states use population data from the census to redraw election maps. In theory, this redistricting process ensures that there are the same number of people in each district, giving them equal representation in Congress. In practice, though, the process is often mired in partisan attempts to gerrymander districts to benefit one political party over another. Thatcher figured there had to be better ways to think about drawing district maps, so she decided to look for them.
